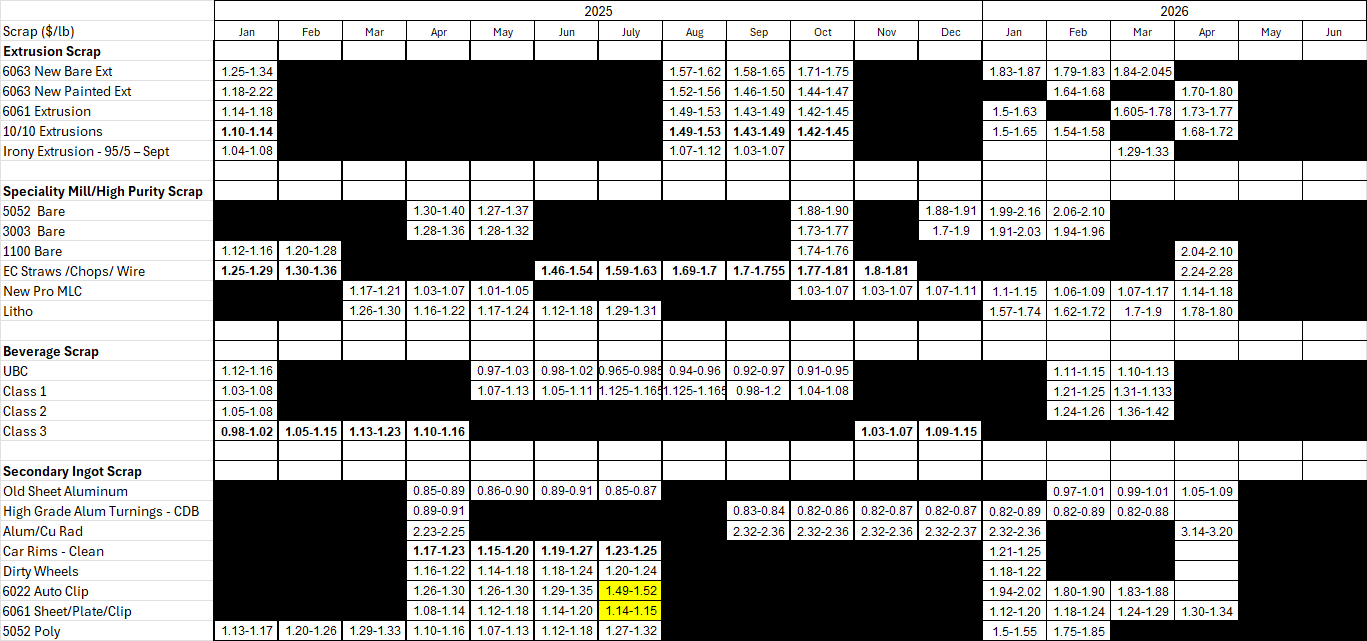
Historical Spread Analytics (2020–2025)
Five years of scrap spread data doesn’t just tell you where prices have been — it tells you how the market behaves under different conditions: tightening cycles, trade policy shocks, seasonal demand swings, and everything in between. That behavioral pattern is what turns a price history into a forecasting edge.
What this module covers:
Monthly spread tracking across major scrap grades (UBC, class scrap, 6061, 6063, 5182, and others) relative to MWTP
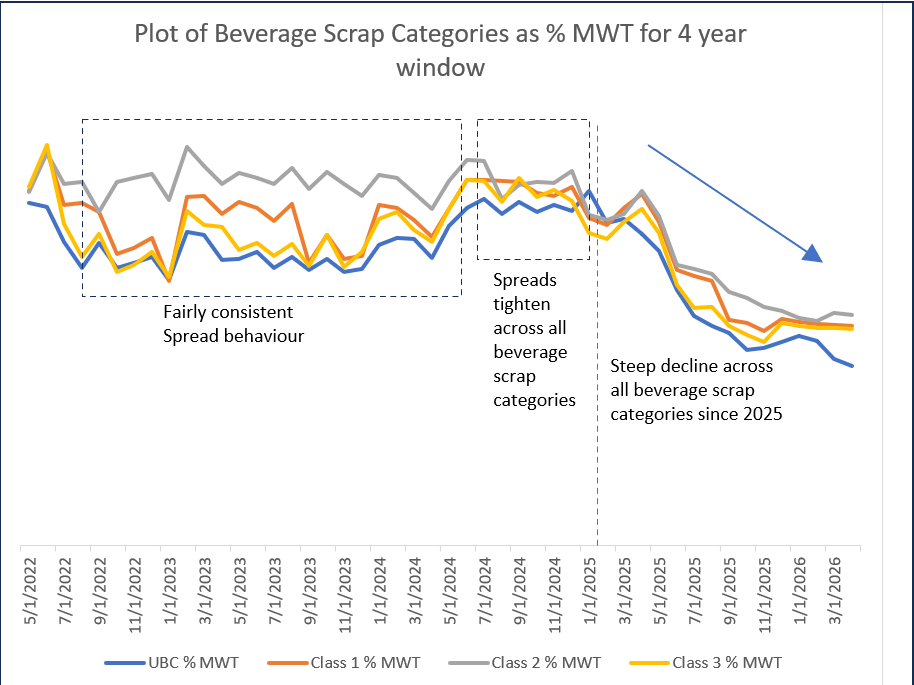
Full market-cycle coverage — 2020’s demand collapse, the 2021–2022 tightening, and the UBC discount widening through 2H 2025 and 2026
Regional spread divergence, not just national averages
Annotated inflection points tied to underlying drivers — trade policy shifts, mill outages, capacity ramp-ups — so the “why” travels with the “what”
Sample insight, generalized: A recent multi-month period saw one major scrap grade’s discount to MWTP widen well beyond its five-year norm before beginning to compress — a pattern with real implications for anyone timing scrap purchases or sales. These widened spreads have directly impacted the profitability of a few rolling mills as noted on various earnings calls. The full chart, with more current dates and magnitudes along with additional supportive material to assess impact on rolling mills, is available to subscribers and demo participants.
This is just one example of a dataset built from years of tracking scrap markets from the inside — not reconstructed after the fact from published averages.
Full historical files and interactive spread tools are available to subscribers. Demos are conducted live via screen-share, with sample data provided for review.